|
Excel: It All Adds Up
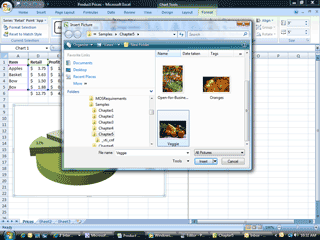
3. Browse
for a picture You can use
your own picture, or you can use one of the sample pictures. Double click
the picture that you want. You should see
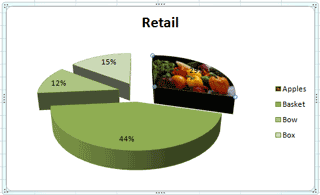
a pie chart similar to the one illustrated on this page. The purpose of
this exercise is to make your graph say more to your audience. Does your
chart "Show and Tell?" Does it teach as well as entertain?
|
|||
|
| |||


