|
Excel: What Happened?
This
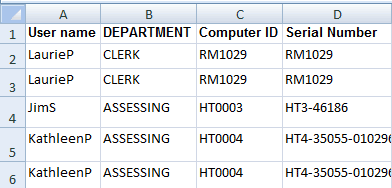
lesson uses a sample file. Please download a copy of the Bug Report spreadsheet. This is
what the data from 72 Bug Reports looks like when you review them in
Excel. Scroll down the list: there are many reports for each
department. How many? There are reports concerning different
software problems. Which software? How would
you count and graph
these reports? PivotTables.
Three Parts to a Spreadsheet:
These labels will become an important part of your
PivotTable. Take some time to think through what data you are
capturing and measuring. If it isnít on the list, how can you sort or
calculate?
|
|||
|
| |||


