|
Excel: What Happened?
Select the
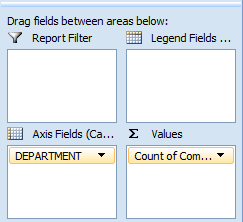
Fields and Count the Value, just as you did for the
PivotTable Report. Choose
the Field: Department You should
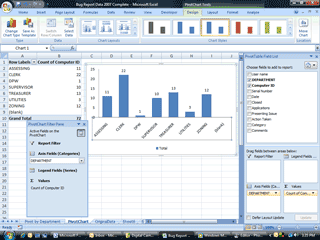
see a PivotTable on the left side of your spreadsheet but there
will not be any data in the Chart, yet. Count
the Data: Computer ID Drag and
Drop the Computer ID field to the Value on the bottom. Well, did
you get a Chart?
PivotTable Tools ->Design
->Chart Layout |
|||
|
| |||


