|
PowerPoint: In Your Field
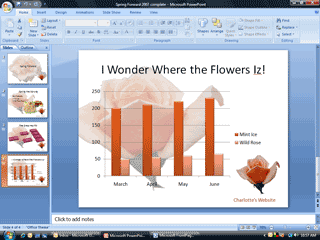
This is something interesting: the Mighty Excel Chart Tools are available in Microsoft
PowerPoint, too. The Design Ribbon offers a rich formatting
palette.
Try it: Select a Chart Style
Select the Chart
Go to Chart Tools ->Design
Play with the Styles.
Where's the data? Somewhere, there is a set of
bits and bytes in the spreadsheet format that has this chart in it.
However, the chart you just created is embedded in the
PowerPoint. It does not exist as a separate mypowerpoint.xls file.
You can open the embedded spreadsheet and go to Office-> Save As
to create one if you wish. |
|||
|
| |||


