|
PowerPoint: In Your Field
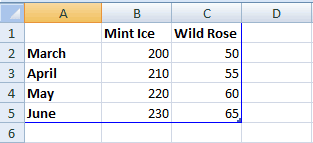
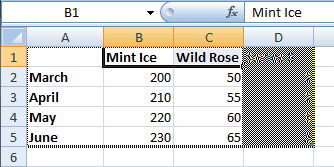
This is an embedded Chart you began in Microsoft
PowerPoint. The Chart Wizard set up a Named Range for the
labels and data. The default includes three data columns: B, C, and
D.
Column D is not required in this Chart.
Try it: Change the Range
Look for the blue border that indicates the Named
Range.
Resize the border the same as you would resize
a picture. |
|||
|
| |||