|
PowerPoint: In Your Field
Charts tell another story: how are we doing? What are
the numbers? Are we gaining or losing?
Microsoft PowerPoint has a way to embed a spreadsheet
into the presentation. That means the spreadsheet is part of the
show, not a separate workbook that you can edit and save.
This function was very limited in previous versions of
PowerPoint. It's worth another try in Office 2007.
8. Insert a Chart
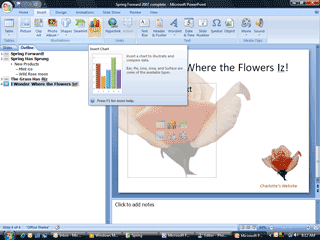
Start on Slide 4
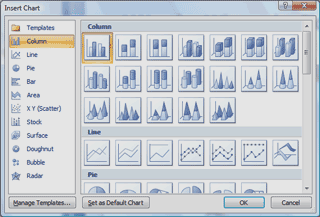
Go to Insert -> Chart
Choose the Column layout |
|||
|
| |||


