|
Excel: Rain Washes Hamburg
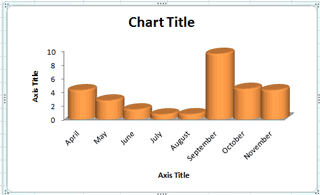
In this example, the September data is significant. You
can use the Layout and Chart Styles to emphasize the
September data, the main story that the chart is teaching.
7. Change the Chart Design
Go the the Design Ribbon
Select Chart Layouts
Scroll through the Layout Gallery and select a
simple design with no legend
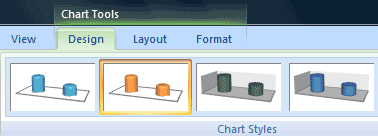
Go to the Chart Styles
Select a Style from the Gallery.
|
|||||
|
| |||||


