|
Excel: Rain Washes Hamburg
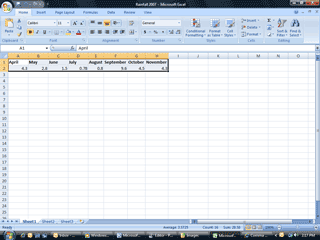
4. Enter the rainfall data. In April it rained 4.3 inches.
Click on cell A2 and type 4.3. You don’t need to add the word “inches.”
In May it rained 2.8. June got 1.5. In July things turned to dust with
only .78 inches. August wasn’t much better with .8. The rains they came
in September: 9.6 inches. In October it was back to normal at 4.5 inches
and November had 4.3 inches of precipitation.
5. Select the Range
To make a graph, first select the data. Nothing happens until you select
it. Click on cell A1 and hold your left mouse button. Slide across to
H2. All of the labels and data are selected now. Are you with me?
|
|||||
|
| |||||


